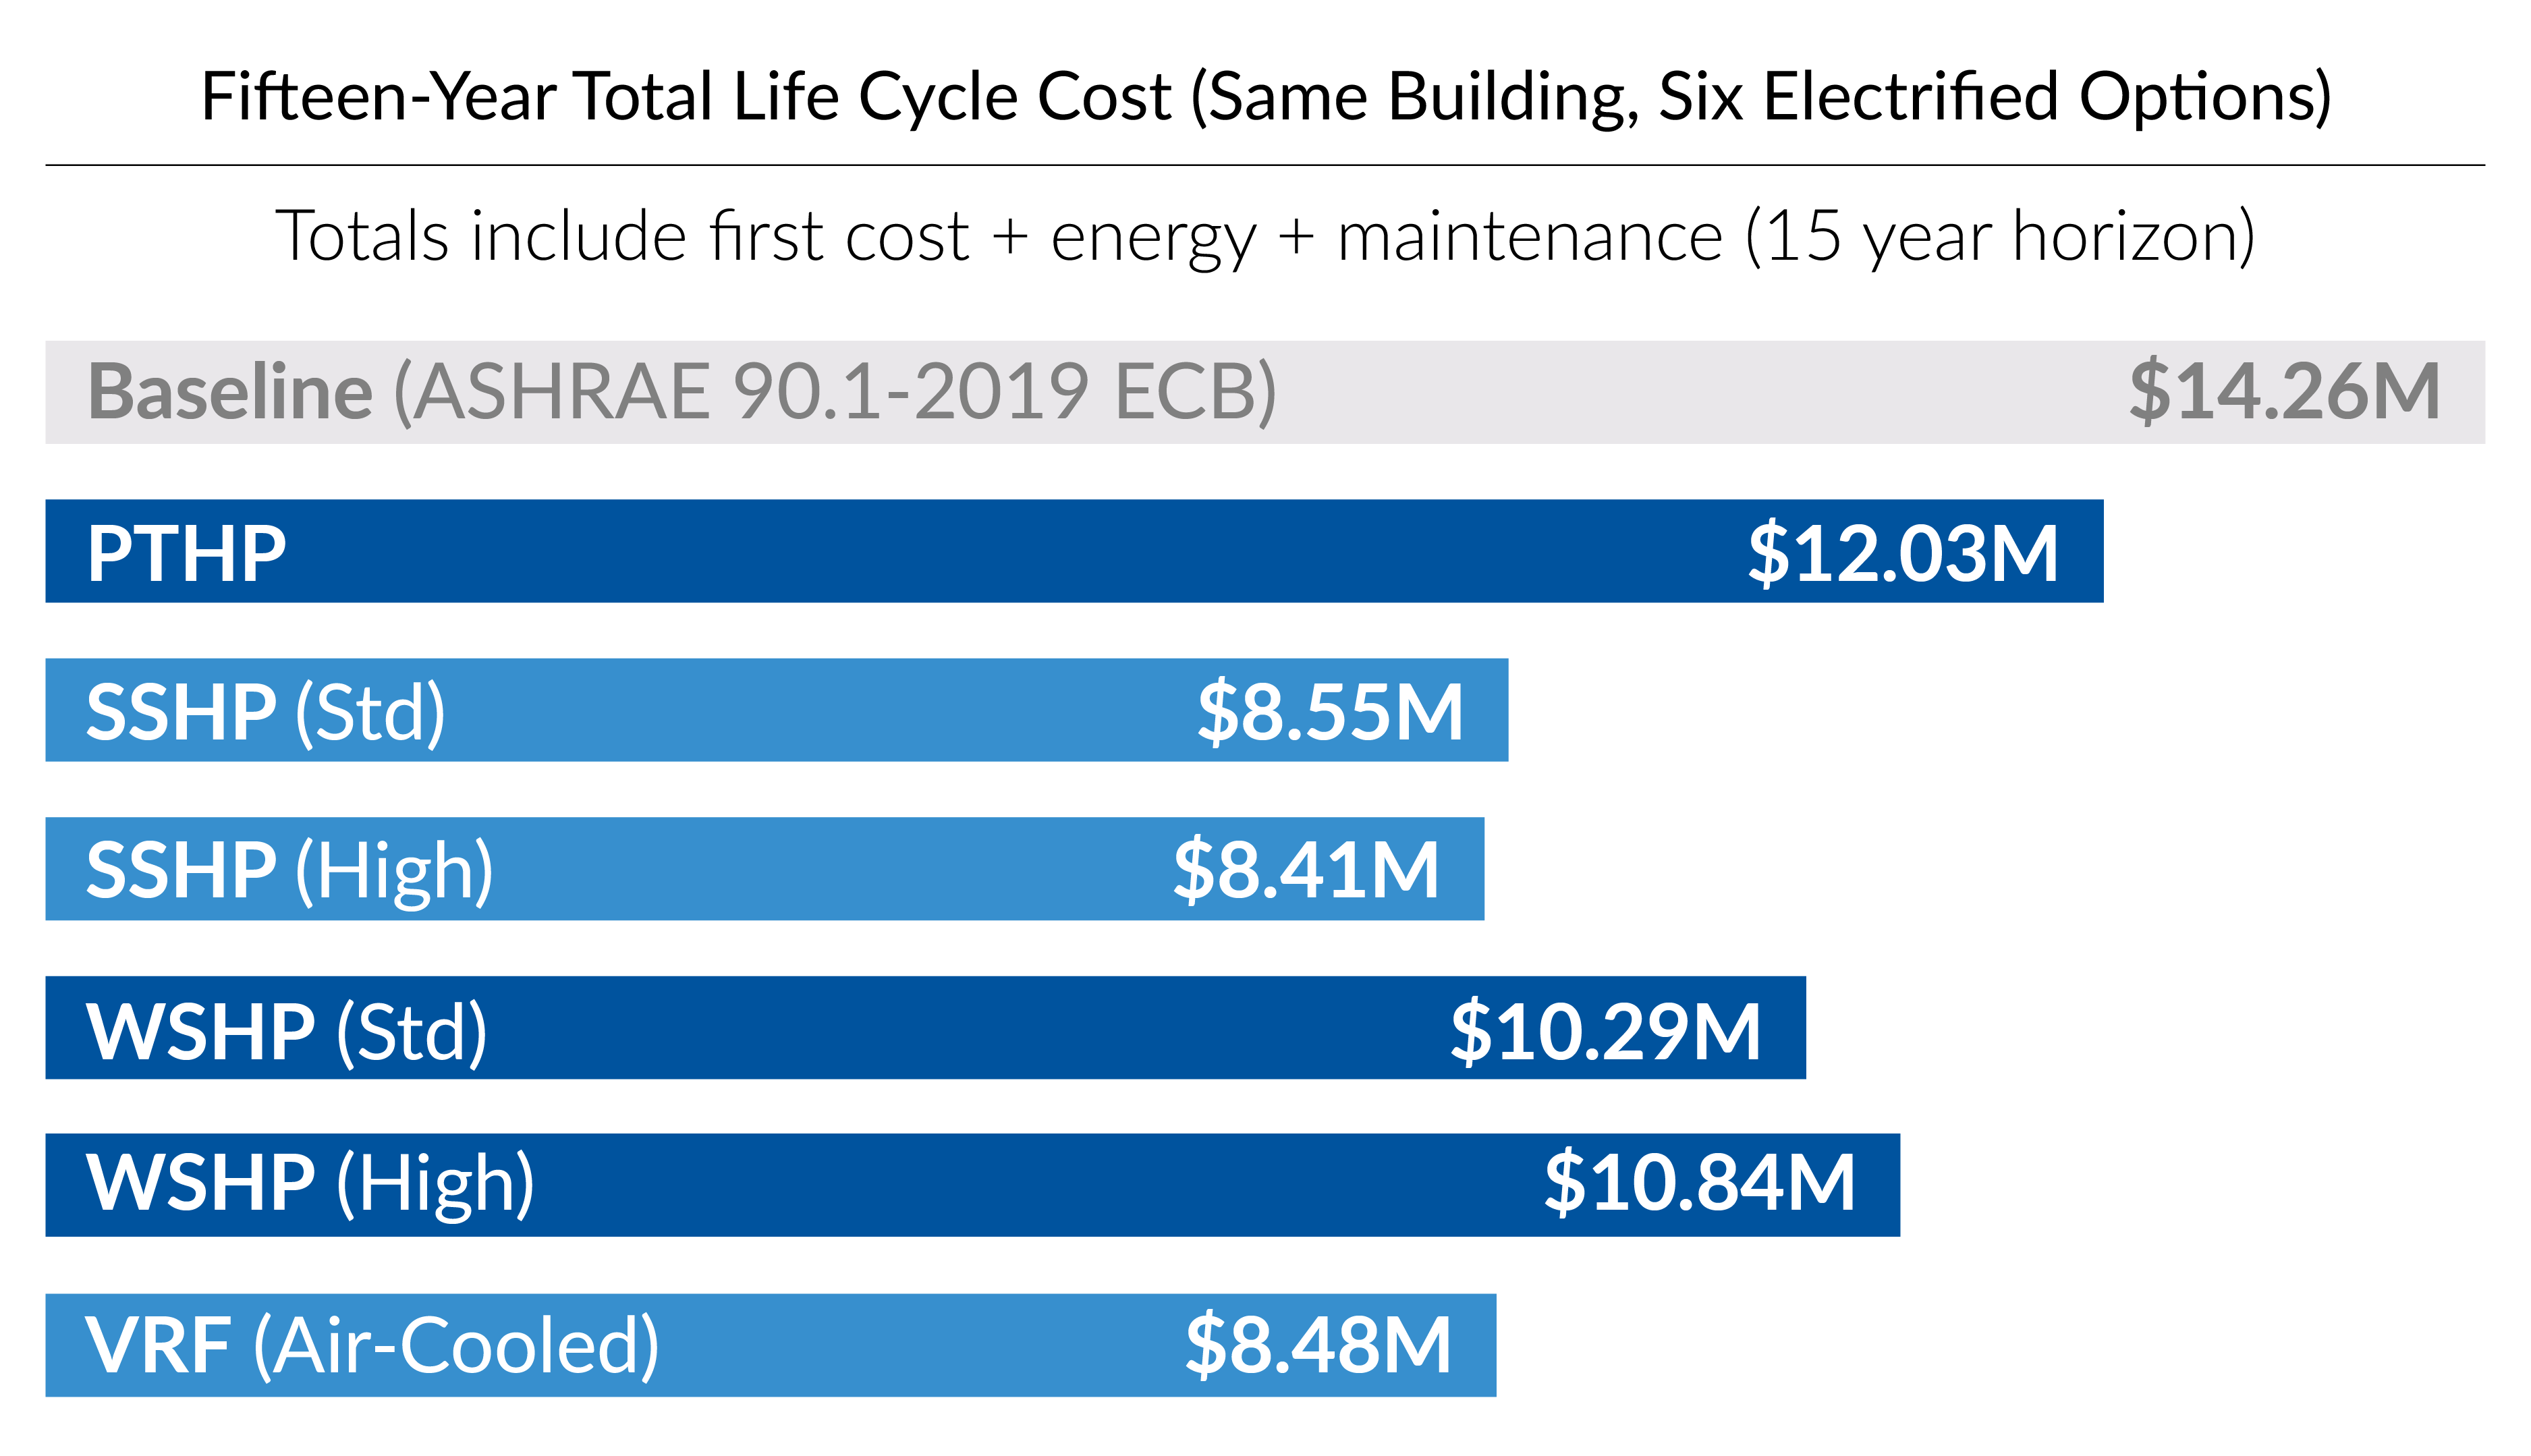
15-year Total Life Cycle Overview
The chart below compares the 15-year total life-cycle cost across six electrified HVAC options using the same building and assumptions.
The three lowest outcomes are Split System Heat Pump (Standard efficiency) SSHP Std, Split System Heat Pump (High efficiency) SSHP high, and Variable Refrigerant Flow (Air-cooled) VRF Air-Cooled.
*15-year total cost (present value)
Across the six systems, differences aren’t driven by a single variable.
First cost, energy performance, maintenance assumptions, and how long you plan to own the building all interact differently depending on the system type. In this study, split-system heat pumps and air-cooled VRF produced the lowest 15-year total costs, while water-source systems improved materially when paired with different central plant assumptions. (shown later).
The findings below show where those differences come from and which assumptions matter most when applying the results to a real project.
Seven Key System Findings
1. Delivered first cost ranges show clear tiers
Delivered costs include equipment and installation for new construction ($/sq ft). Ventilation, plumbing, and rebates are not included.
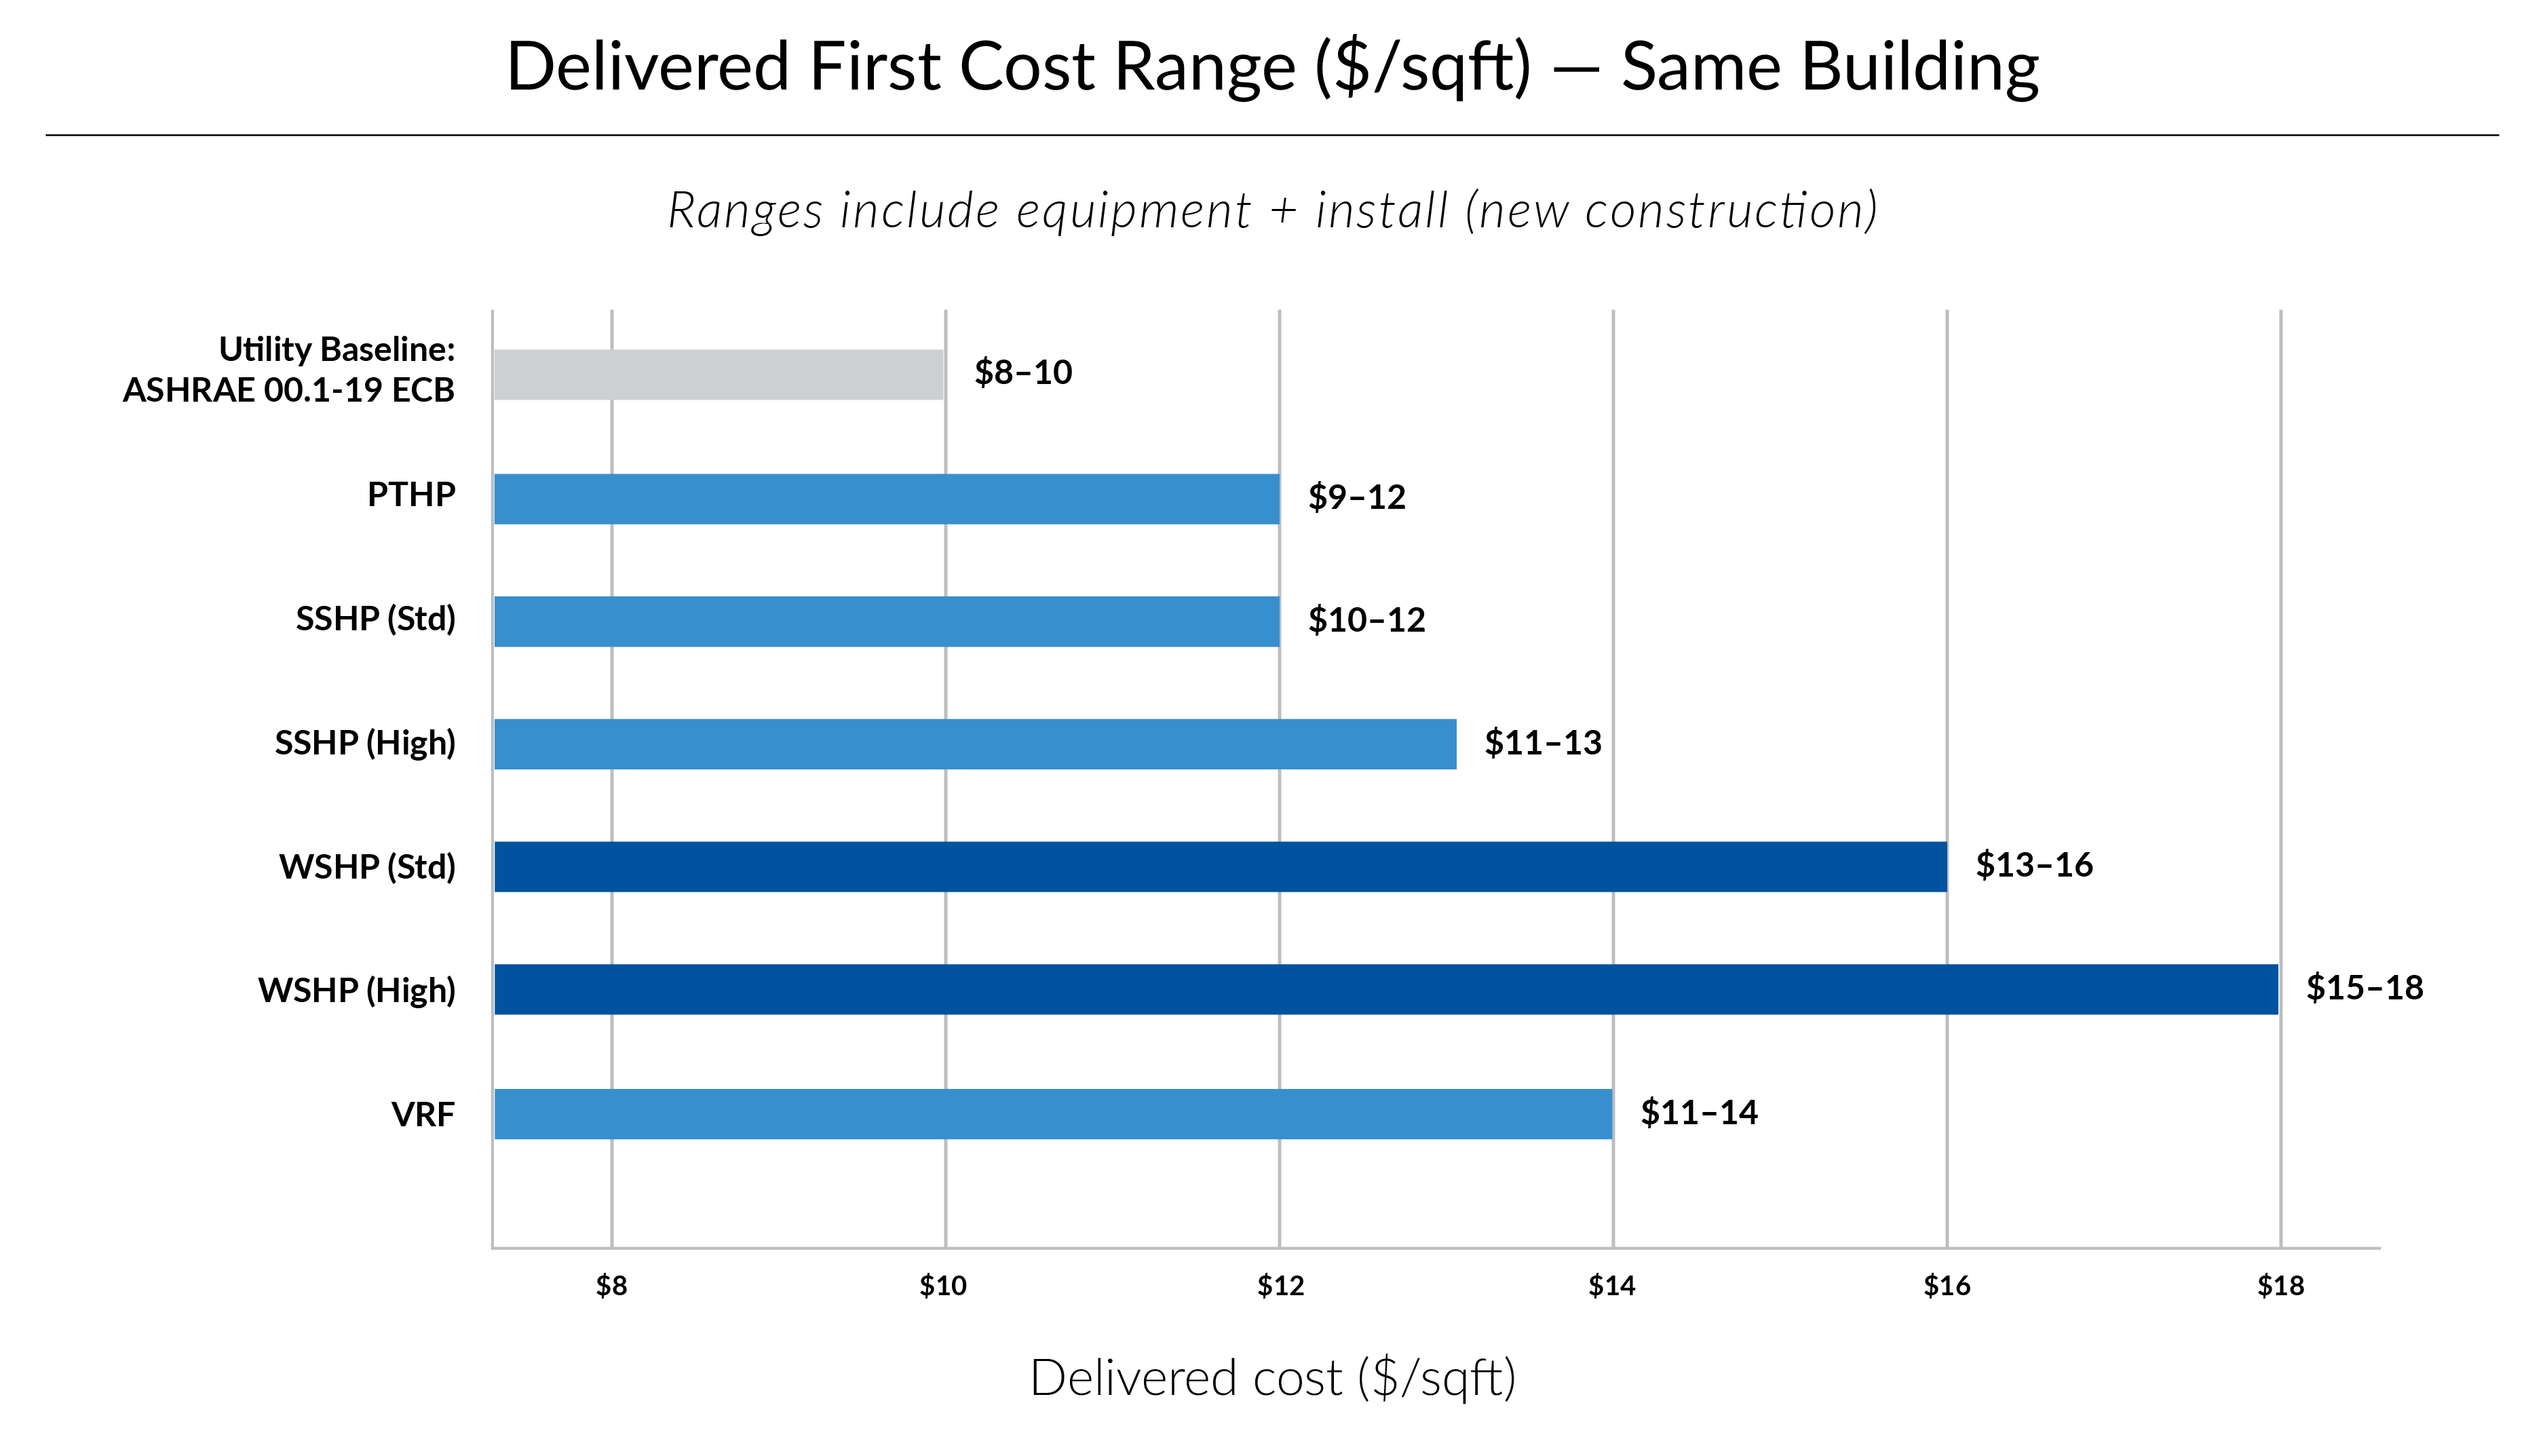
Water-source heat pumps (WSHP) had the highest total cost. Split-system heat pumps and air-cooled VRF were closer to the middle. Packaged Terminal Heat Pumps (PTHP) appear to be the budget option, but that depends on how many units you need.
If you’re trying to keep costs down, start by comparing split systems vs. VRF. Consider WSHP only if your project is already set up to support the central plant approach.
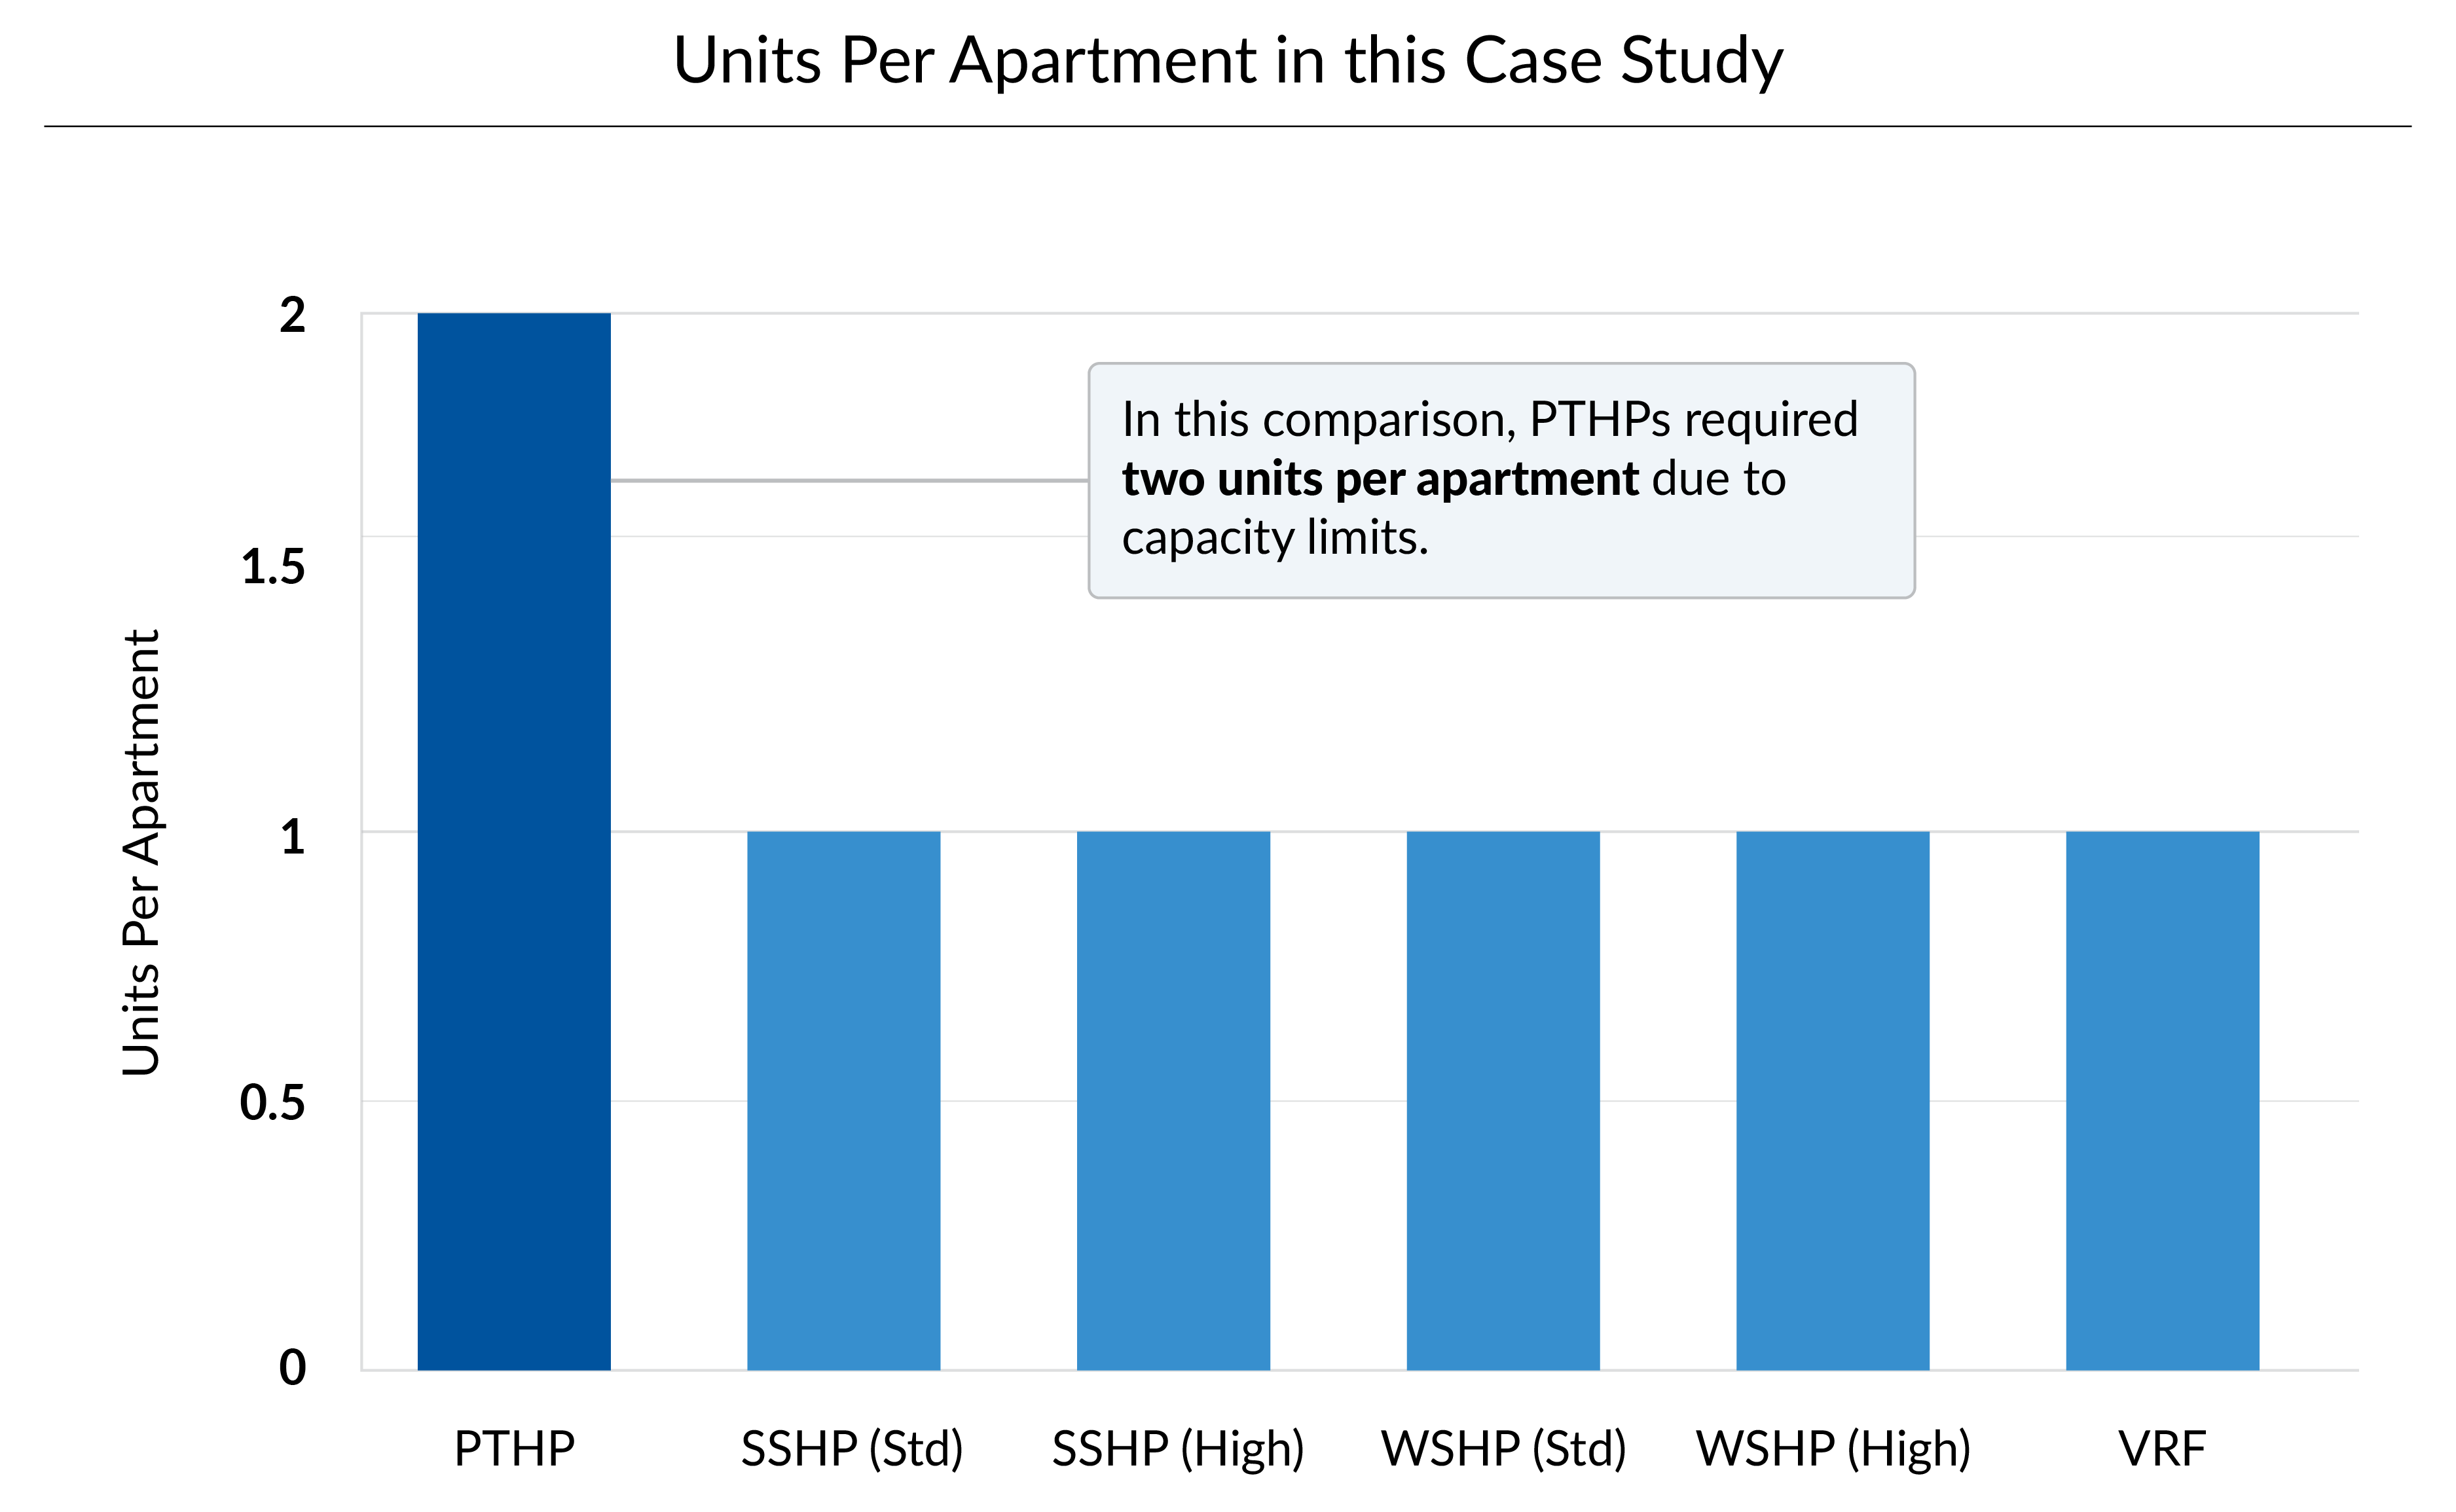
In the modeled building, PTHP required more units per apartment due to capacity limits increasing installed costs.
First cost is heavily influenced by how many units you need to buy and install. Here’s what that looked like in this building.
2. PTHP “Unit Count” increased cost and maintenance
Each apartment needed roughly 2 tons of cooling capacity. The PTHP option was modeled at about 1.5 tons per unit, so this example required two PTHP units per apartment to meet capacity requirements. If you are considering PTHPs, confirm per-unit capacity and your apartment load early. Unit count drives equipment cost, installation labor, and future service calls.
In this study, we consulted with Davis Construction. They confirmed that from a construction and operations standpoint, unit count matters. Increasing units per apartment increases installation effort, coordination, and long-term service touchpoints, even if the equipment itself appears lower cost.
3. Utility rebates and first cost
Rebates can offset first cost, but they are a one-time event and program-specific. We show them because they are useful for budgeting but not blended into the life cycle totals.
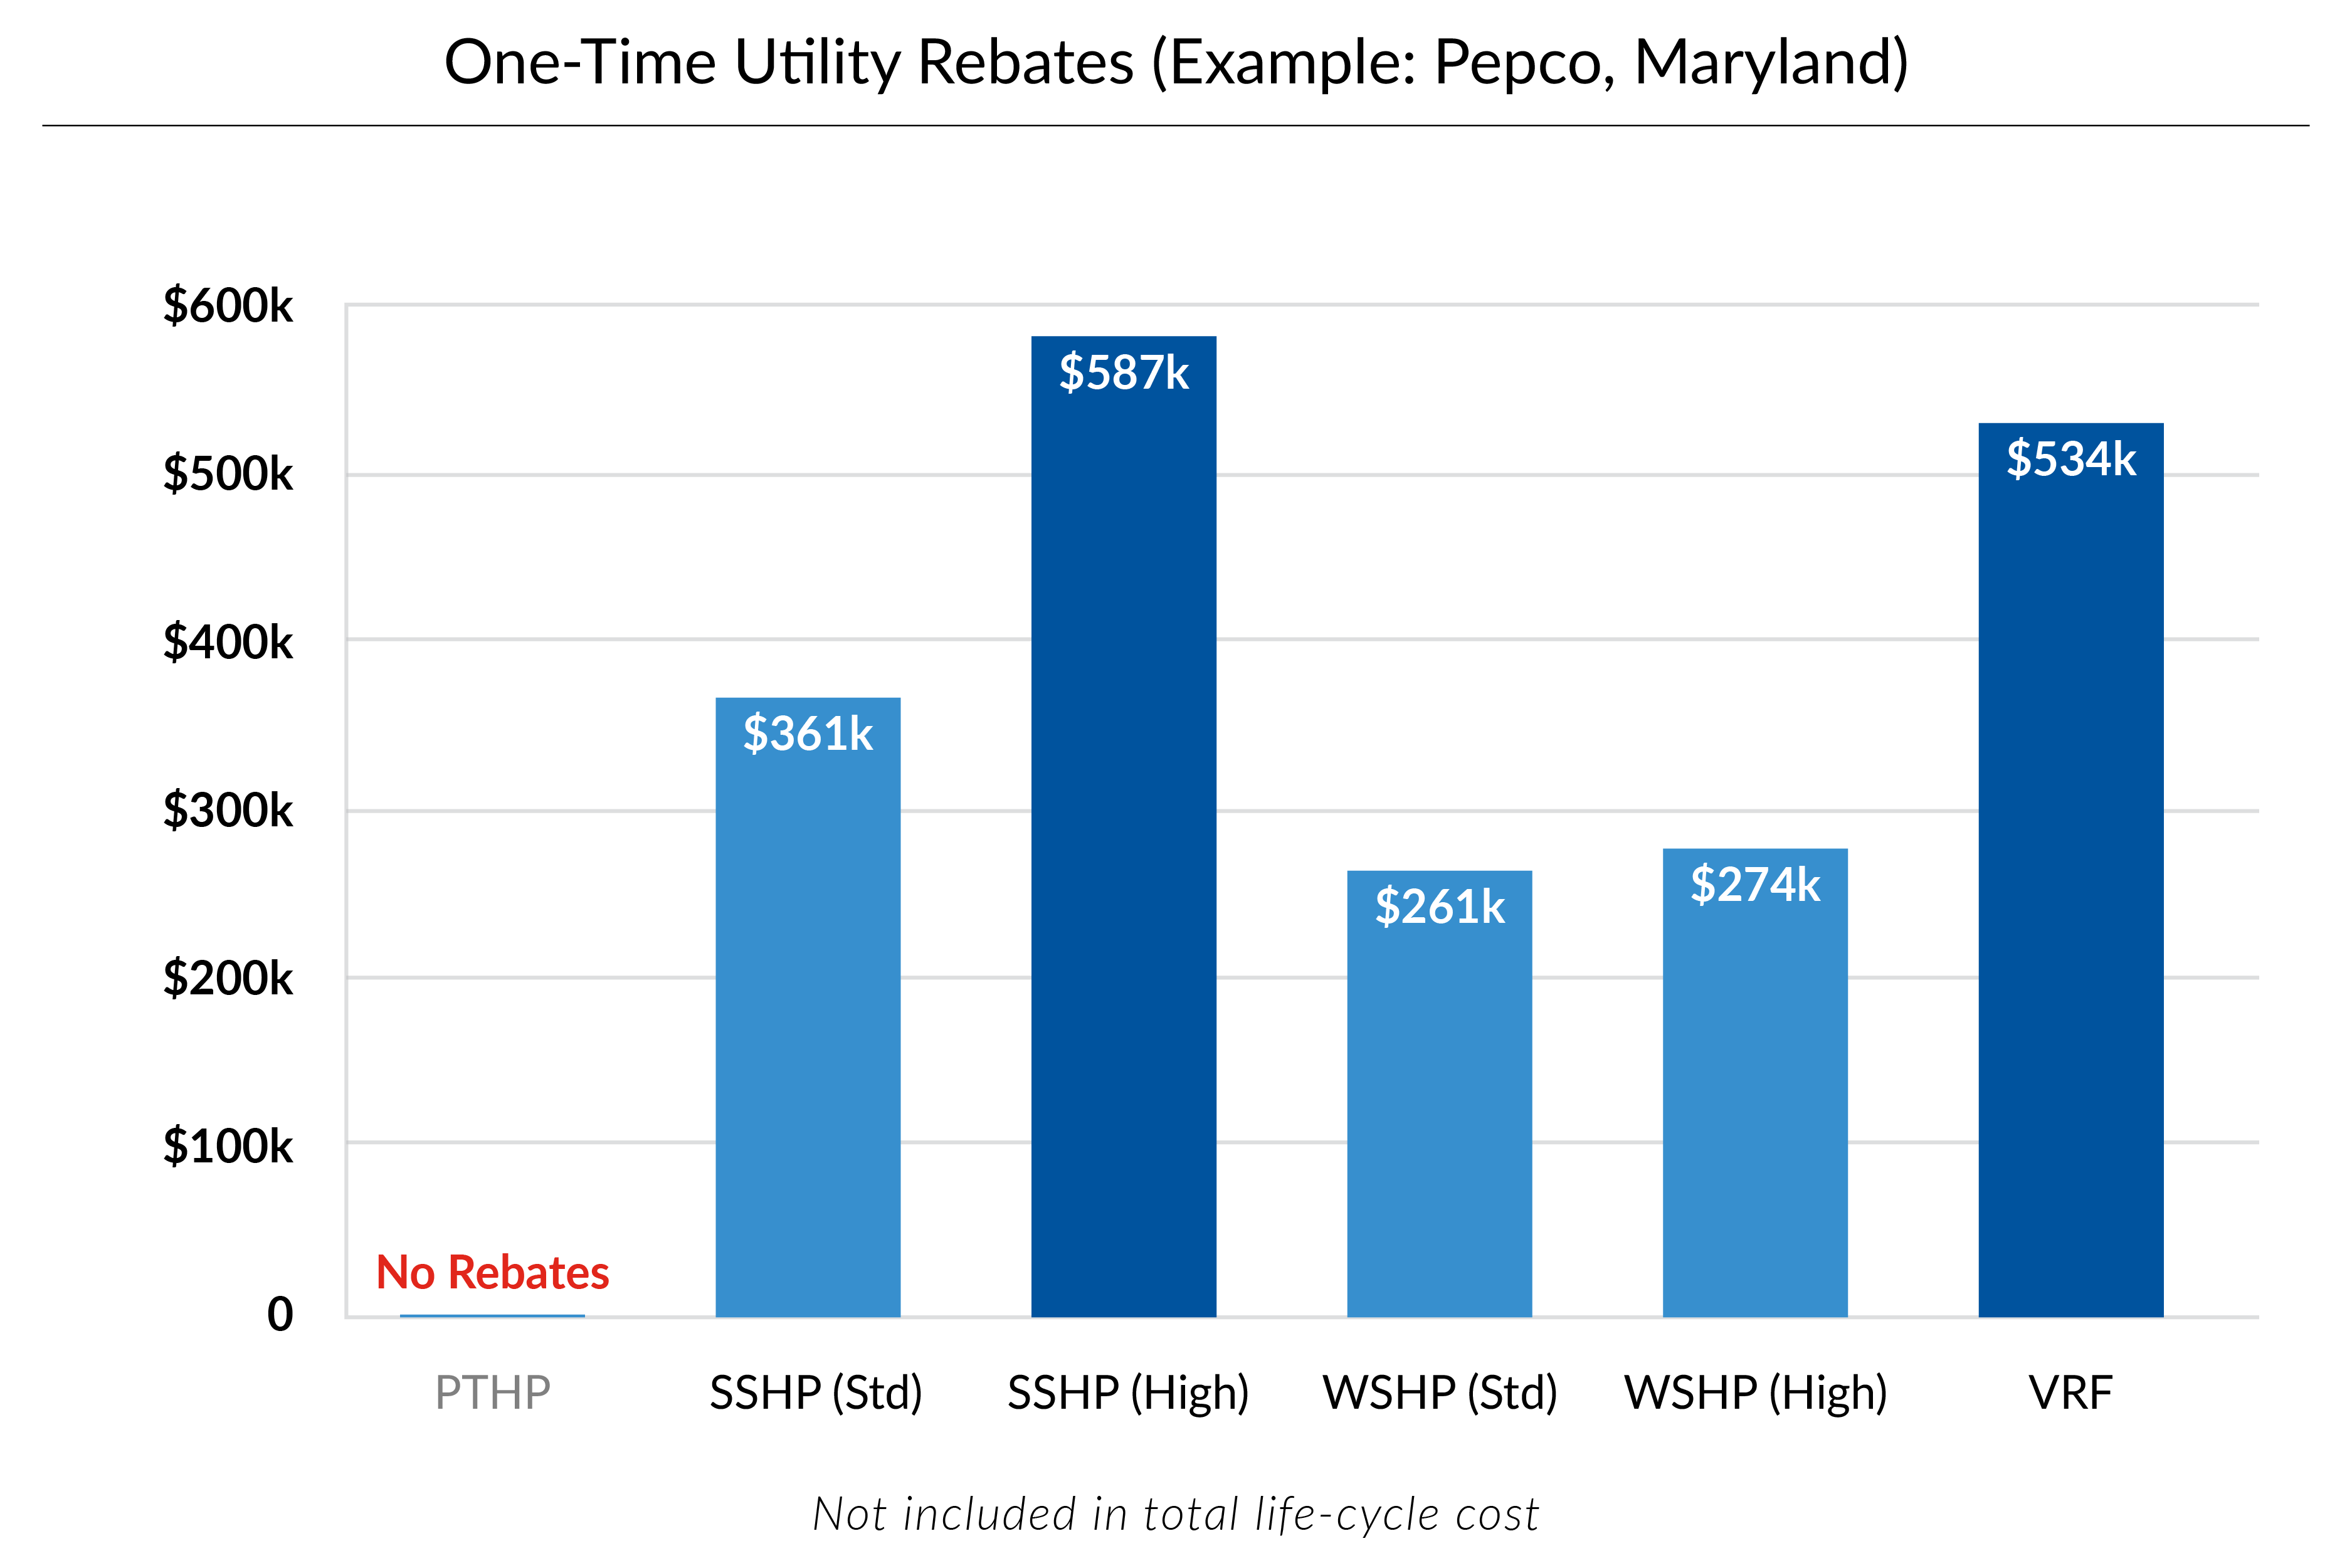
VRF and SSHP High can outperform other options in rebate value. Base your decision on first cost minus rebates and life cycle cost, viewed side by side. Don’t blend them and hide the trade-offs.
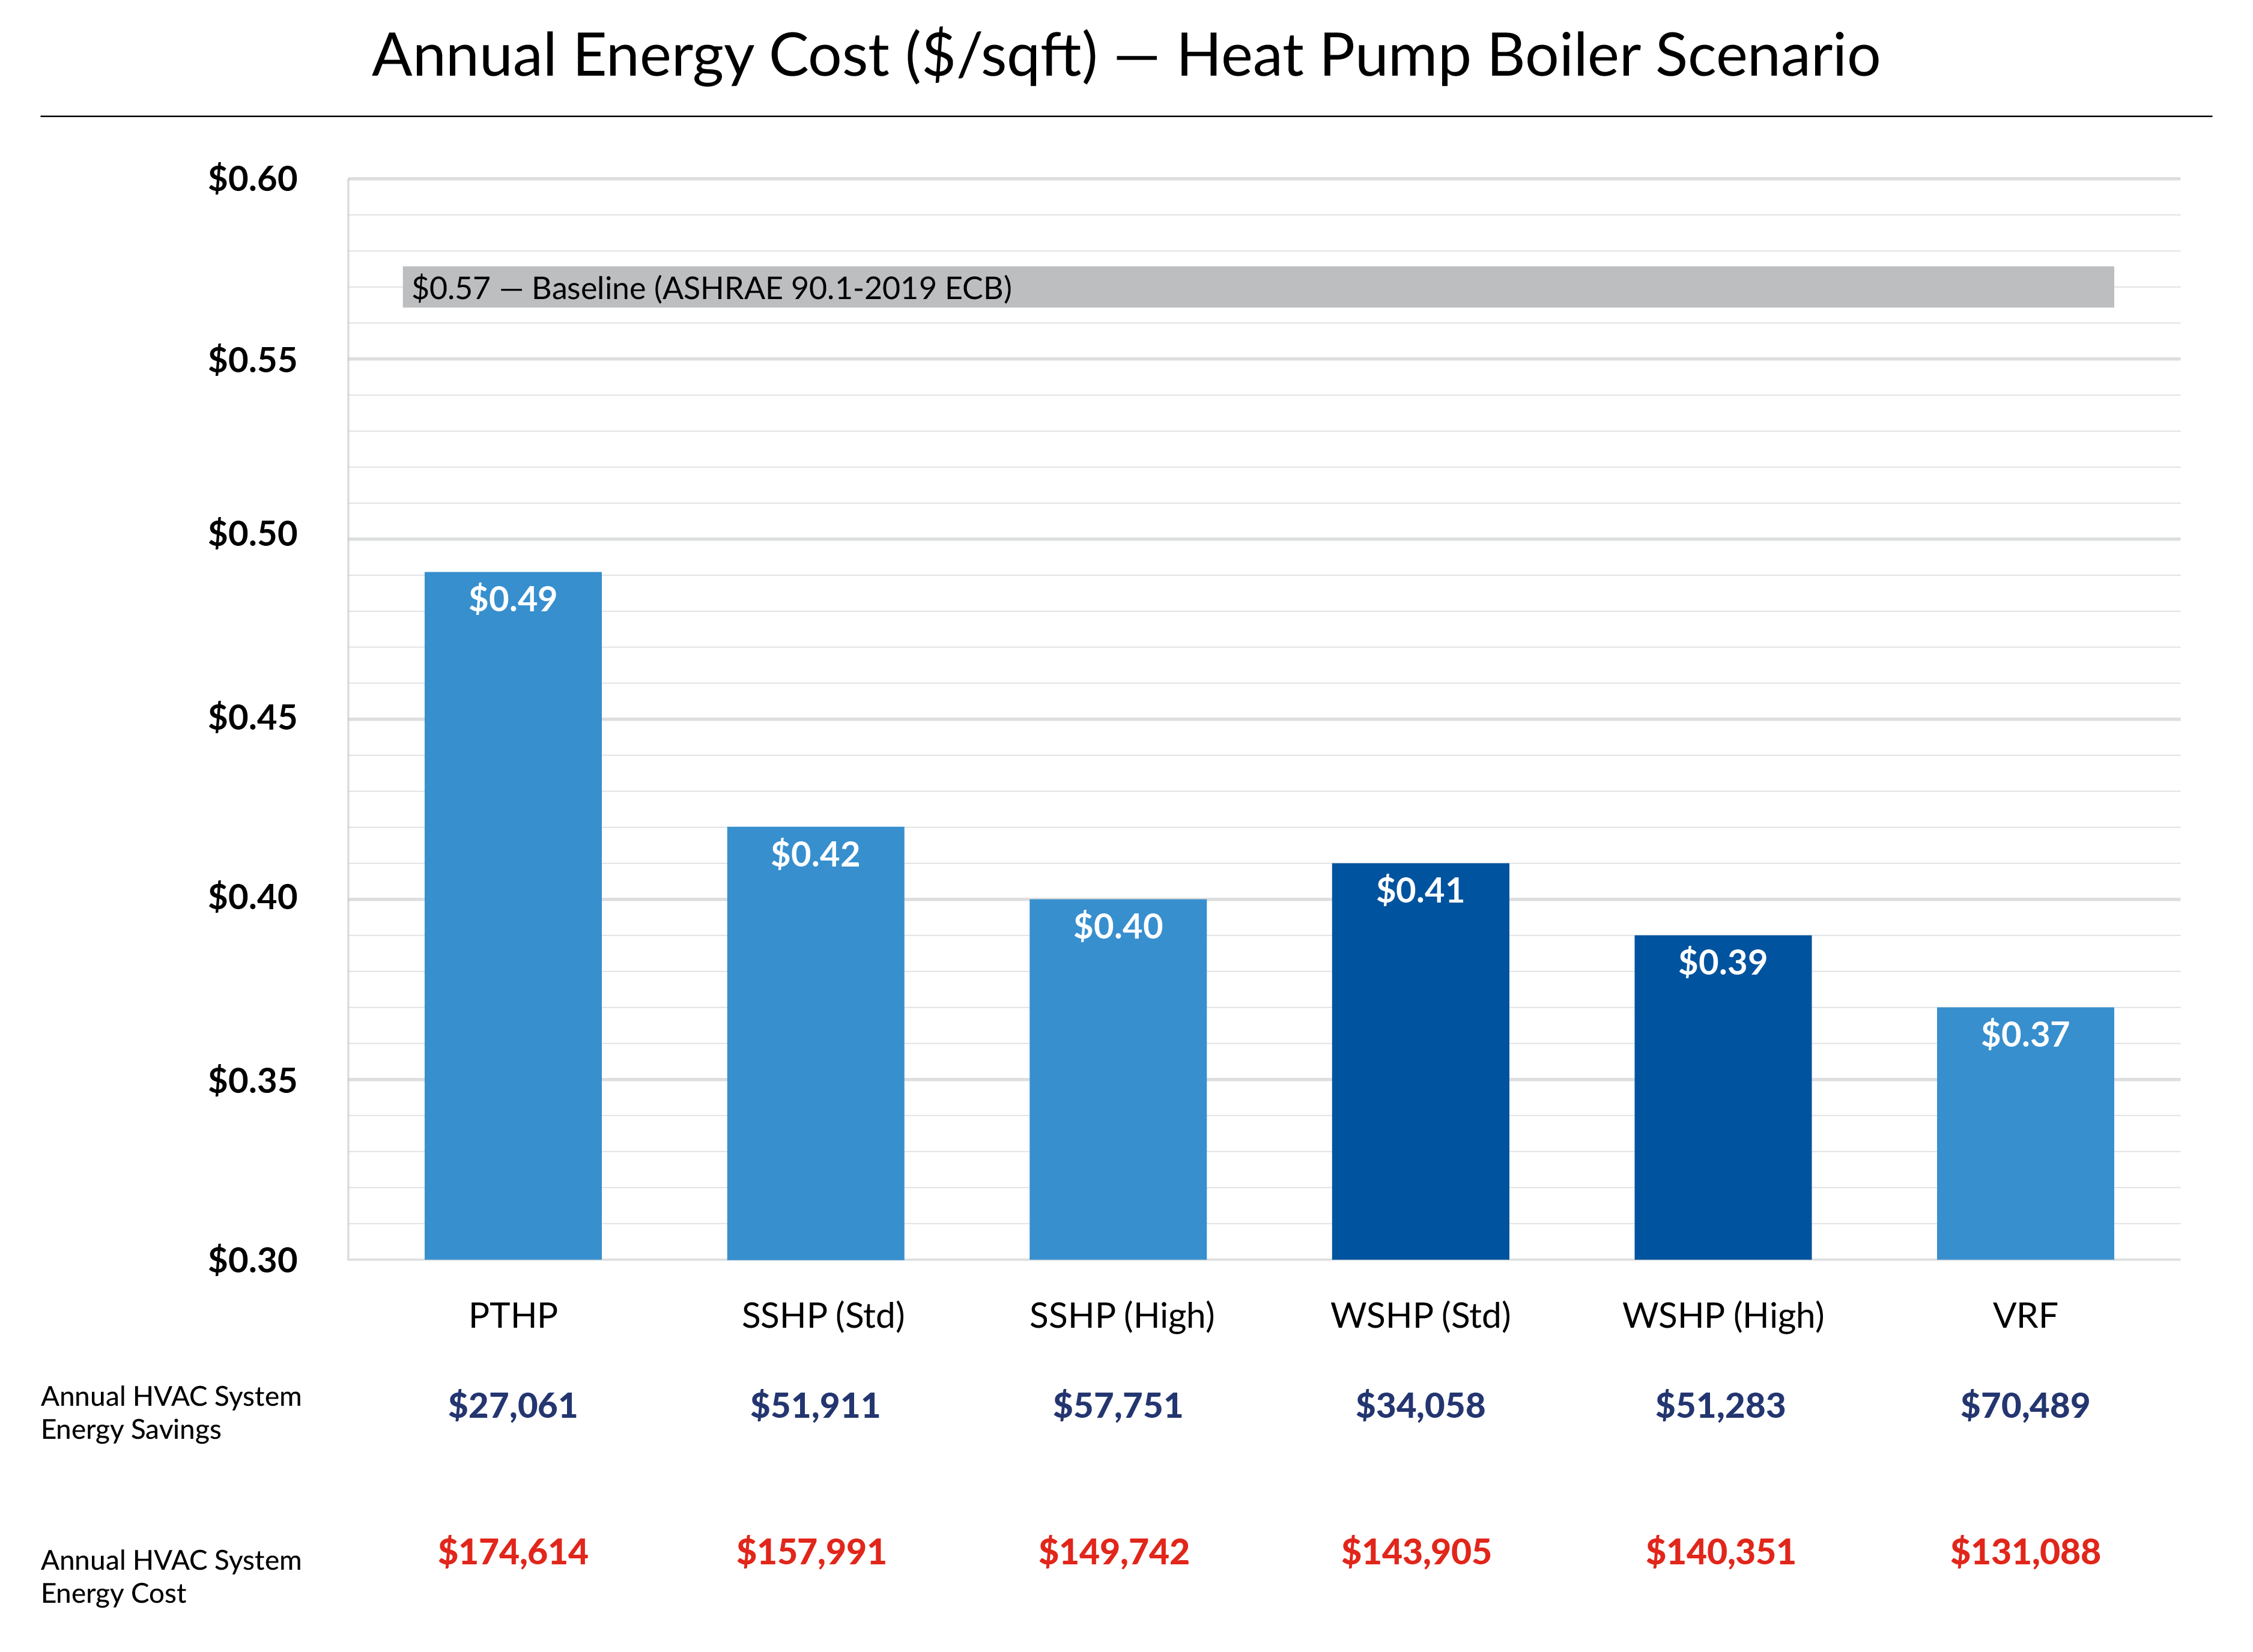
The next two charts show the modeled annual HVAC electricity cost for the same building, one with electric boilers and one with heat pump boilers.
4. Higher annual energy cost with electric boilers
This chart shows modeled annual HVAC electricity cost when the WSHP options use an electric boiler at the central plant. In this scenario, VRF has the lowest annual electricity cost, and both split system options perform well.
The key takeaway is that WSHP energy cost is sensitive to the central plant heating choice, and an electric boiler pushes the WSHP results higher in this model.
With an electric boiler, WSHP energy cost is higher in this study.
5. Lower annual energy cost with heat pump boilers
This chart shows the same building and the same assumptions, but the WSHP options are paired with a heat pump boiler instead of an electric boiler. Notice what changes. The split system and VRF results stay essentially the same, but both WSHP options cost drops. The takeaway is that the central plant heating choice is part of the WSHP system decision and it can change the outcome.
With a heat pump boiler, WSHP energy cost drops and becomes more competitive in this study.
“For systems that rely on a central plant, the plant configuration is part of the system choice. Changing the boiler assumption materially changes the WSHP results in this study, which is why those decisions should be evaluated together rather than in isolation.”
— Jen Xiong, Energy Engineer III, Spectrum Energy
6. Maintenance costs reflect service type
Maintenance values reflect manufacturer-recommended service activities for this modeled building and are shown for comparison. Recalculate using your staffing and service approach before applying to a project.
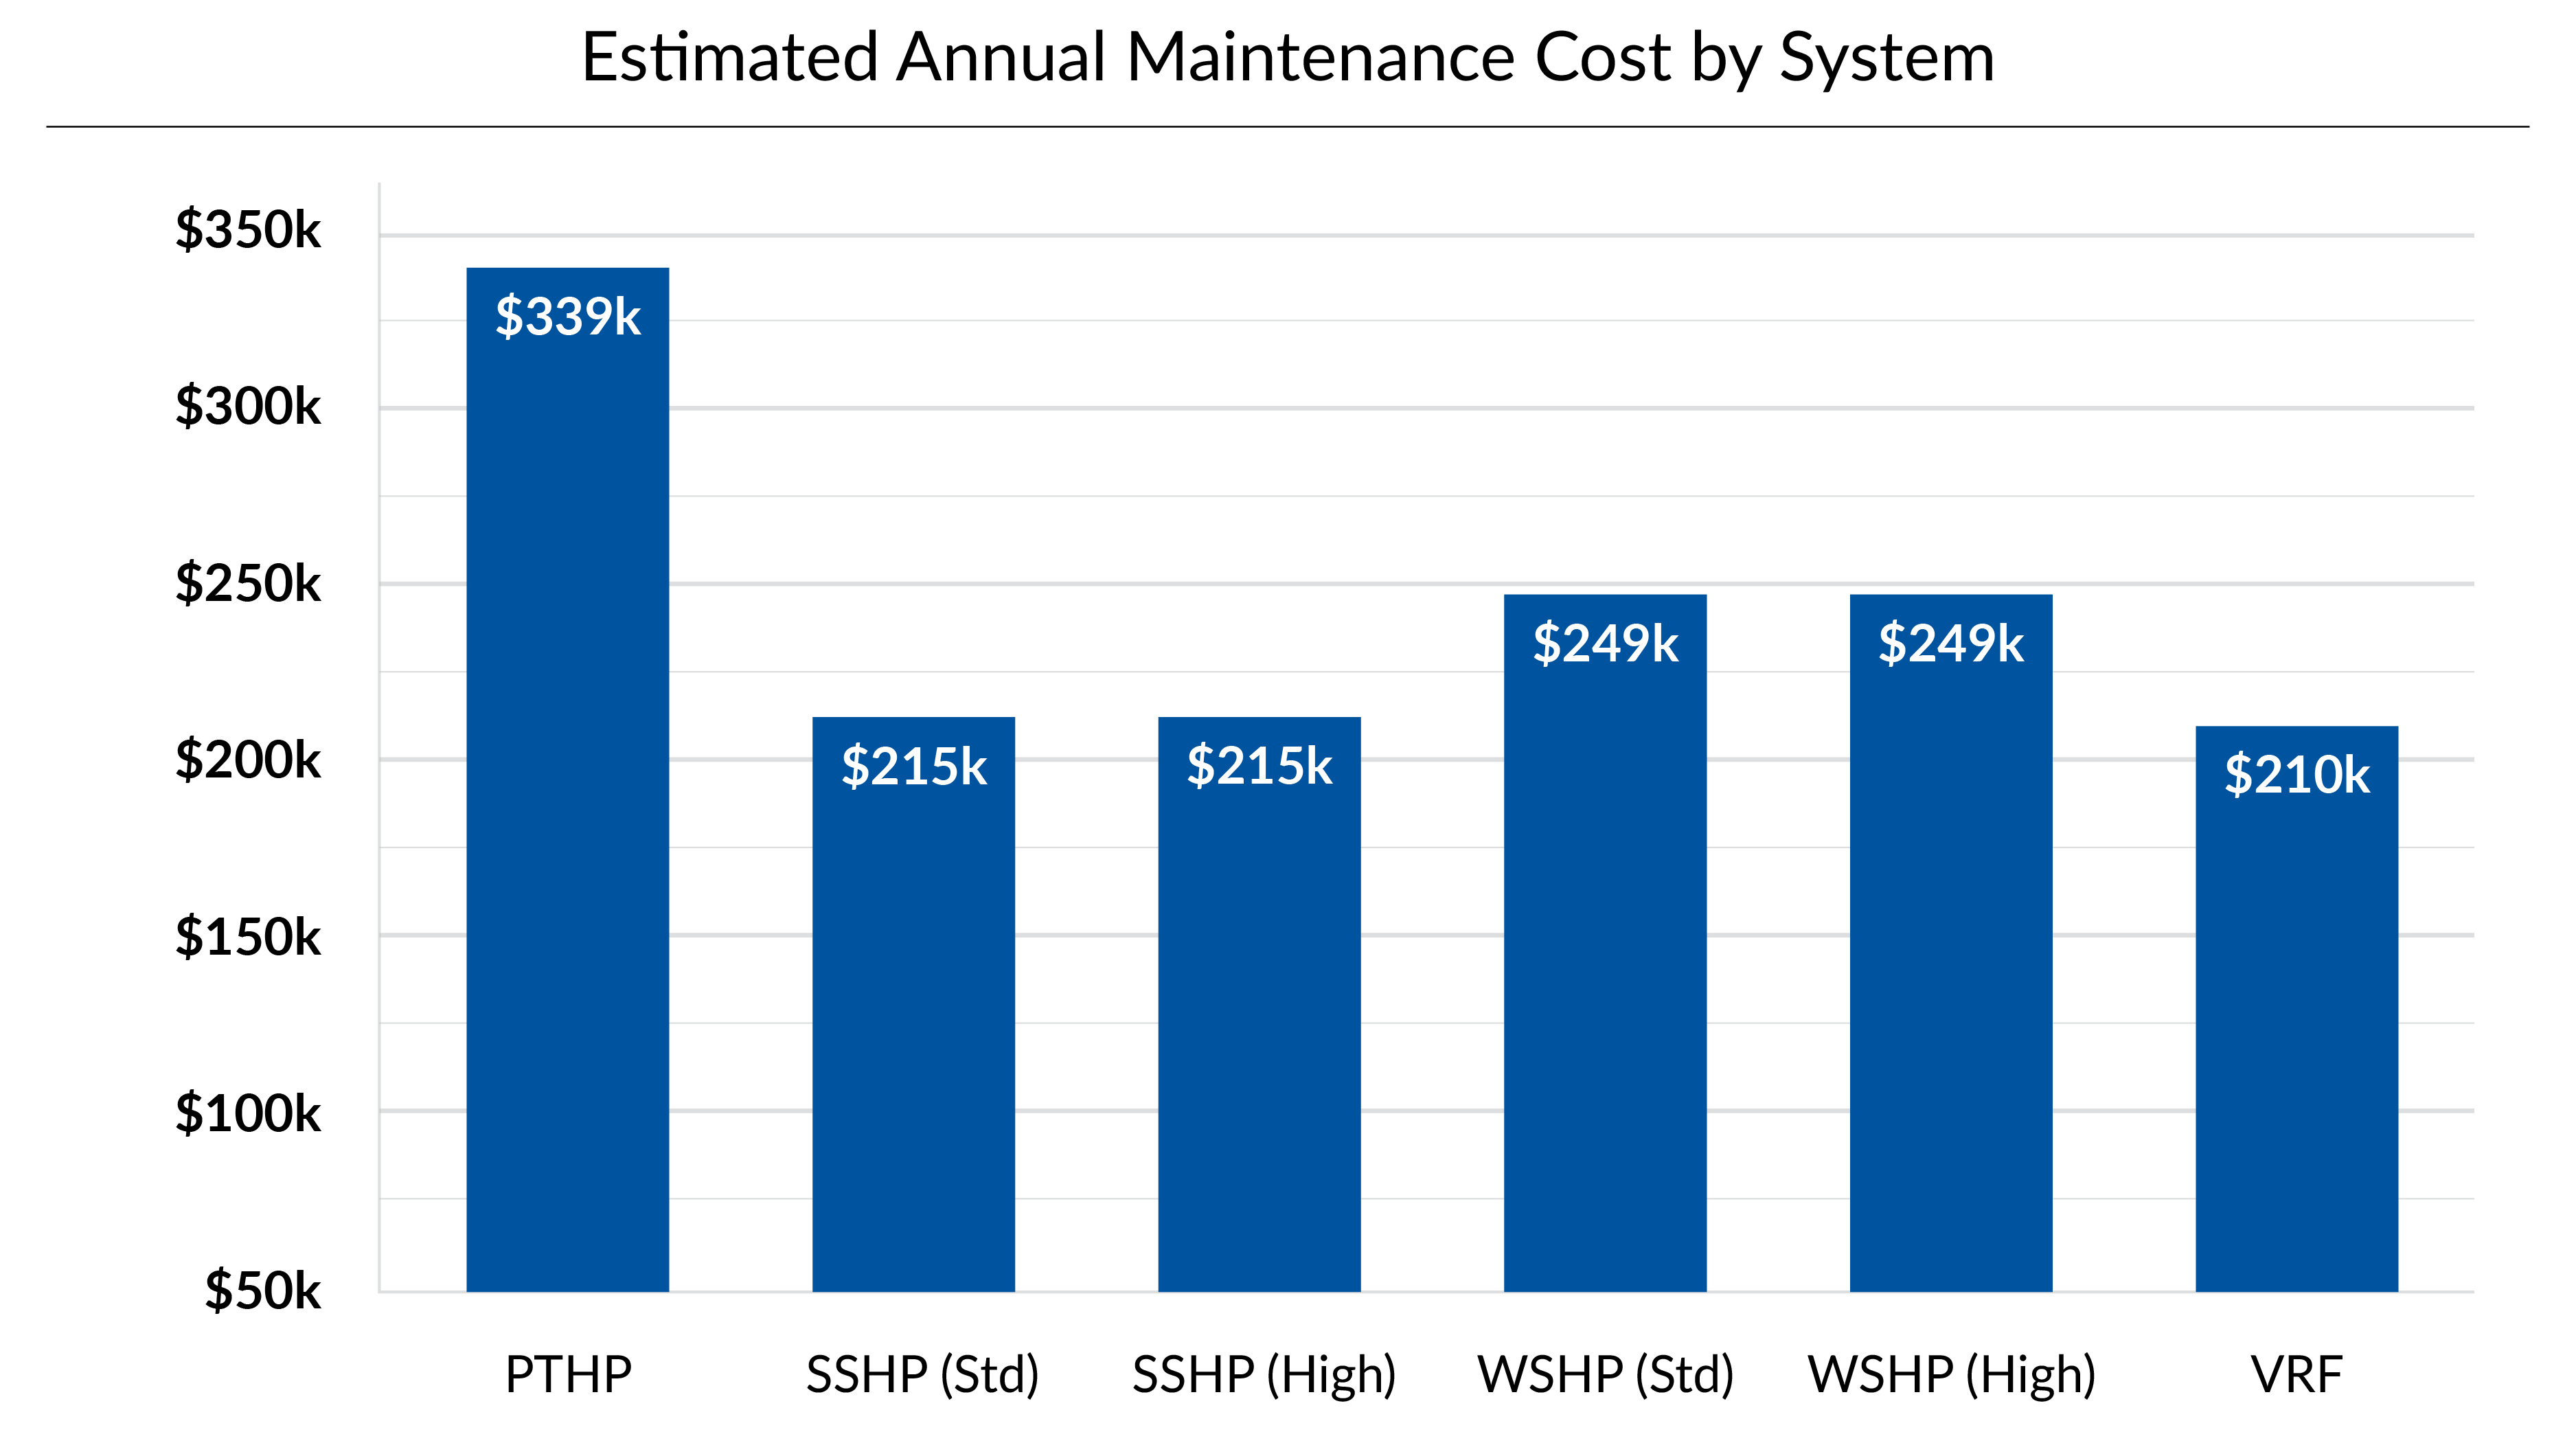
In this study, because PTHPs were modeled as two units per apartment, it increased the number of filters, inspections, and service touches the building has to manage. The model also assumed multiple filter changes plus an annual checkup per unit, which may be more than how some portfolios maintain PTHPs in practice.
Treat this chart as a planning range, then check it against how you perform maintenance:
- Are filters changed by in-house technicians or through a 3rd party?
- Do you change “filters-only” most years, or do full inspections on a set schedule?
Those choices affect the outcome more than people expect, and they’re specific to your staffing model and service standards.
Maintenance is what you staff for and manage through service calls.
Now, looking back to the 15-year total cost example, ownership horizon and replacement timing can change how these annual differences add up.
7. Fifteen-year total cost varies across systems
The lowest 15-year total life cycle costs are SSHP High, SSHP Std, and air-cooled VRF.
A 15-year view aligns with many ownership plans, but it is still a snapshot. If you expect a longer ownership period, equipment replacement timing can become a larger part of the decision and should be evaluated separately.
Our guide to HVAC equipment lifespan planning ranges helps you estimate replacement timing when you are evaluating holding your building longer than 15 years.
The totals help you compare systems. The right answer depends on how long you’ll own the building and what you assume for replacements.
“These results are best used as a comparison framework. Actual project outcomes depend on whole building designs, utility rates, service practices, and ownership strategy, which is why we encourage teams to re-run the assumptions for their specific situation.”
— Jen Xiong, Energy Engineer III, Spectrum Energy
Choosing the Right System
✅ Best fit 🟦 Situational 🟧 Not a primary fit
|
Your Concern |
PTHP |
SSHP (Std) |
SSHP (High) |
WSHP (Std) |
WSHP (High) |
VRF |
|
Minimize 15-year total cost |
🟧 |
✅ |
✅ |
🟧 |
🟧 |
✅ |
|
Cut yearly HVAC electric bills |
🟧 |
✅ |
✅ |
🟦 |
🟦 |
✅ |
|
Avoid central plant ‘it depends’ variables |
🟦 |
✅ |
✅ |
🟧 |
🟧 |
✅ |
|
Biggest improvement if the central plant gets more efficient |
🟧 |
🟧 |
🟧 |
✅ |
✅ |
🟧 |
|
Quickest to repair or swap out |
✅ |
🟦 |
🟦 |
🟧 |
🟧 |
🟦 |
*Comparison based on study assumptions.
No option “wins” in every scenario. The best-fit depends on how long you plan to own the building, who pays the utility bills, how the system will be serviced day-to-day, and (for water-source systems) the central plant concept you’re operating.
Before applying these results to your building, keep three things in mind:
- How long do you plan to own the building? Shorter holds favor a lower first cost. Longer holds reward lower operating costs.
- Who pays utilities? If the owner pays, efficiency savings matter more.
- For water-source systems, is the central plant part of the system? Plant assumptions can noticeably change outcomes.
If these match your situation, the results should translate well. If not, the rankings may shift.

Tim Dorman
Innovative Solutions Director, Havtech